How to Calculate Compound Interest Quickly and Accurately
Learn how to calculate compound interest with clear formulas, real-world examples, and actionable tips to boost your savings today.
Recommended Extensions
Understanding Compound Interest Formula
Looking for a clear way to see how your savings can snowball? The compound interest formula, A = P(1 + r/n)^(nt), ties together your initial deposit, interest rate, compounding frequency, and time into one powerful calculation.
Compound interest means you earn interest on interest—and that effect really kicks in over multiple periods. To make sense of it, let’s unpack each component:
- P (Principal): Your starting balance
- r (Rate): Annual interest rate, shown as a decimal
- n (Frequency): How many times interest is added each year
- t (Time): Duration of your investment in years
- A (Amount): What you end up with after compounding
You’ll often see banks advertise a yearly rate but apply it monthly or daily. Understanding the difference between annual percentage rate and actual compounding schedule helps you avoid unwelcome surprises.
Imagine you open a high-yield savings account with $10,000 at 5% annual interest, compounded monthly for 5 years. Here’s how the numbers come together:
- Convert the rate to decimal form: r = 0.05
- Find the periodic rate: r ÷ n = 0.05 ÷ 12
- Add one to the result: 1 + 0.004167 = 1.004167
- Apply the exponent over all periods: (1.004167)^60
- Multiply by the principal: 10,000 × 1.2834 ≈ $12,834
That boost represents just over a 28% gain, all without adding another cent.
Summary Of Compound Interest Variables
Below is a quick reference for each symbol in our formula, complete with sample values drawn from the example above. Keep this table nearby when you’re experimenting with different rates, frequencies, or time horizons.
| Variable | Definition | Sample Value |
|---|---|---|
| P | Principal amount | $10,000 |
| r | Annual interest rate (decimal) | 0.05 |
| n | Compounding periods per year | 12 |
| t | Time in years | 5 |
| A | Future value after compounding | $12,834 |
Keep these definitions in mind as you explore monthly, daily or even continuous compounding scenarios. With the table at your side, tweaking any variable in a spreadsheet or calculator becomes a breeze.
Understanding Key Variables

Grasping compound interest starts with five essentials: the principal (P), annual rate (r), compounding frequency (n), time horizon (t), and the resulting amount (A). Tweak any one of these, and your end balance shifts dramatically.
Imagine putting down $5,000 at 5% per year. Now bump the rate to 6% or switch from yearly to monthly compounding. You’ll see how even small changes can reshape long-term growth.
- Principal (P): Your starting deposit or investment.
- Annual Rate (r): Growth rate expressed as a decimal (0.05 equals 5%).
- Frequency (n): How often interest is credited each year (1, 12, 365).
- Time (t): Investment duration in years.
- Amount (A): The future value after compounding.
Exploring Principal And Rate
Seeing how P and r play together helps set realistic targets. Deposit $1,000 at 4% for 10 years, and you use A = P × (1 + r)^t, which becomes 1,000 × (1.04)^10. That calculation delivers about $1,480.
Choosing a sensible rate means digging into historical returns and current savings rates. For instance, expecting double-digit gains when top savings accounts hover around 1.5% is wishful thinking.
“Small percentage differences over decades can double or triple your ending balance.”
— Financial Planning Insight
Next, let’s see how compounding frequency magnifies these effects.
Adjusting Frequency And Time
Moving from annual to monthly compounding packs in extra periods. At 5%, A = P × (1 + 0.05/12)^(12 × 10) turns that same 10-year span into about $1,647 instead of $1,628.
Keep these pointers in mind:
- Convert percentages to decimals before any division.
- Match your n and t units (months vs. years).
- Save rounding for the final result to avoid drift.
If you extend a 3% rate over 20 years with daily compounding, the effective yield jumps by more than 2% compared to annual only. It’s a clear reminder that frequency isn’t just a detail—it’s a driver.
For a deeper dive, check out the ShiftShift guide on calculating compound interest. Practice plugging in different values, and you’ll build the intuition to plan smarter investments.
Calculating Compound Interest Manually
When you work through the formula by hand, the mechanics of growth really start to make sense. Below, we’ll explore how interest stacks up over annual, monthly, daily, and continuous compounding.
Annual Compounding Example
A straightforward annual model uses A = P(1 + r)ᵗ. First, convert the interest rate into a decimal.
- Change 5% into 0.05.
- Calculate (1 + 0.05)¹⁰ = 1.6289.
- Multiply by a principal of $10,000 to get $16,289.
Imagine depositing $10,000 at 5% for ten years—your balance climbs to $16,289, showing how annual reinvestment fuels steady growth.
Monthly Breakdown
Switching to monthly compounding tweaks the formula to A = P(1 + r/12)^(12t). You simply split the rate and adjust the exponent.
- Divide 0.05 by 12 to reach 0.004167.
- Add 1, then raise the result to the 120th power for a decade.
- Multiply by $10,000 to land around $16,470.
That extra compounding cycle each month edges your return slightly above the annual approach.
For wider context, the MSCI World Index in euros delivered a 10.49% CAGR from 1978 to 2025, transforming €1,000 into about €85,000. See the full figures in the NYU Stern data.
Daily And Continuous Compounding
When interest is added every day, use A = P(1 + r/365)^(365t). This daily rhythm nudges returns upward.
- Split the annual rate by 365, then raise the result to 365t.
- For truly continuous compounding, switch to A = P × e^(r t) and let the natural exponent work its magic.
At 5% over ten years, continuous growth yields A = P × e^(0.5), about $16,487—the theoretical ceiling compared to discrete methods.
Long Term Growth Scenario
Extend the horizon and compounding power really shines. Invest $10,000 at 10.49% for 30 years and A = P(1 + r)ᵗ climbs to roughly $217,000.
Benchmarks like MSCI remind us that even small rate differences become huge sums when you give them decades to work.
Small shifts in rate or frequency can translate into thousands of dollars when patience is on your side.
Tips For Manual Calculations
- Keep your decimals precise until the final step to avoid rounding drift.
- Match your time units with the compounding frequency you choose.
- Verify each entry with a basic calculator or spreadsheet—simple typos are common culprits.
Practicing these manual steps builds your intuition. Next, we’ll see how a spreadsheet can automate all of this.
| Frequency | Formula | Example Outcome |
|---|---|---|
| Annual | A = P(1 + r)ᵗ | $16,289 |
| Monthly | A = P(1 + r/12)^(12t) | $16,470 |
| Daily | A = P(1 + r/365)^(365t) | $16,487 |
| Continuous | A = P × e^(r t) | $16,487 |
This table highlights how more frequent compounding gently lifts your final balance. Up next: mastering these calculations in a spreadsheet.
Automating Compound Interest With Spreadsheets And Online Tools
Creating your own compound interest calculator in a spreadsheet is a huge time-saver when testing different scenarios. Once you link P, r, n, and t to cells, built-in functions handle the heavy lifting.
In Excel or Google Sheets, you set up input cells for principal, rate, frequency, and duration. The software then powers through the math.
- Use the POWER function for (1 + rate / n)^(n×t) to track growth precisely.
- Apply EDATE or fill-down formulas to auto-generate a monthly or daily timeline.
- Add data validation dropdowns so users pick interest rates and compounding frequency without errors.
Formatting Input Cells
Label each cell clearly—think “Principal,” “Annual Rate,” “Compounds per Year,” and “Years.” That way, anyone opening the sheet knows exactly where to type values.
Lock your formula cells and mix relative with absolute references. This prevents accidental overwrites while you swap inputs.
Plotting Growth Curves
A quick line or area chart can reveal growth patterns you might miss in raw numbers. Select your time series and future-value columns, then insert the chart you prefer.
- Format series labels with their rate so you can compare scenarios side by side.
- Add axis titles to distinguish principal amounts from time intervals.
- Use markers at key dates to highlight compounding jumps.
Custom colors and symbols bring those inflection points to life, making it easier to spot the impact of different rates.
This view shows how formulas auto-update totals and refresh the chart the moment you tweak a variable. Check out our in-browser compound interest calculator for instant scenario testing within your browser.
Guarding Against Errors
A single typo in a cell reference can skew your entire model. Fortunately, built-in error checking and conditional formatting will flag anything out of bounds.
- Ensure rate entries are decimals (e.g., 0.05 not 5%) to keep units consistent.
- Verify that the frequency dropdown matches the time unit in your exponent.
- Lock header rows so labels stay put when you scroll through long data sets.
Using Template Libraries
Prebuilt templates accelerate setup and minimize formula slip-ups. Online repositories and Sheets’ template gallery are fantastic starting points.
- Install community add-ons featuring financial templates.
- Tweak the template’s principal and rate cells to fit your assumptions.
- Share the finished sheet with colleagues for consistent modeling.
Templates double as learning tools and quick shortcuts when you need to calculate compound interest in multiple scenarios.
Automating these calculations lets you iterate faster and dial in your financial projections. Whether you build from scratch or adapt a template, you’ll master compound interest in no time.
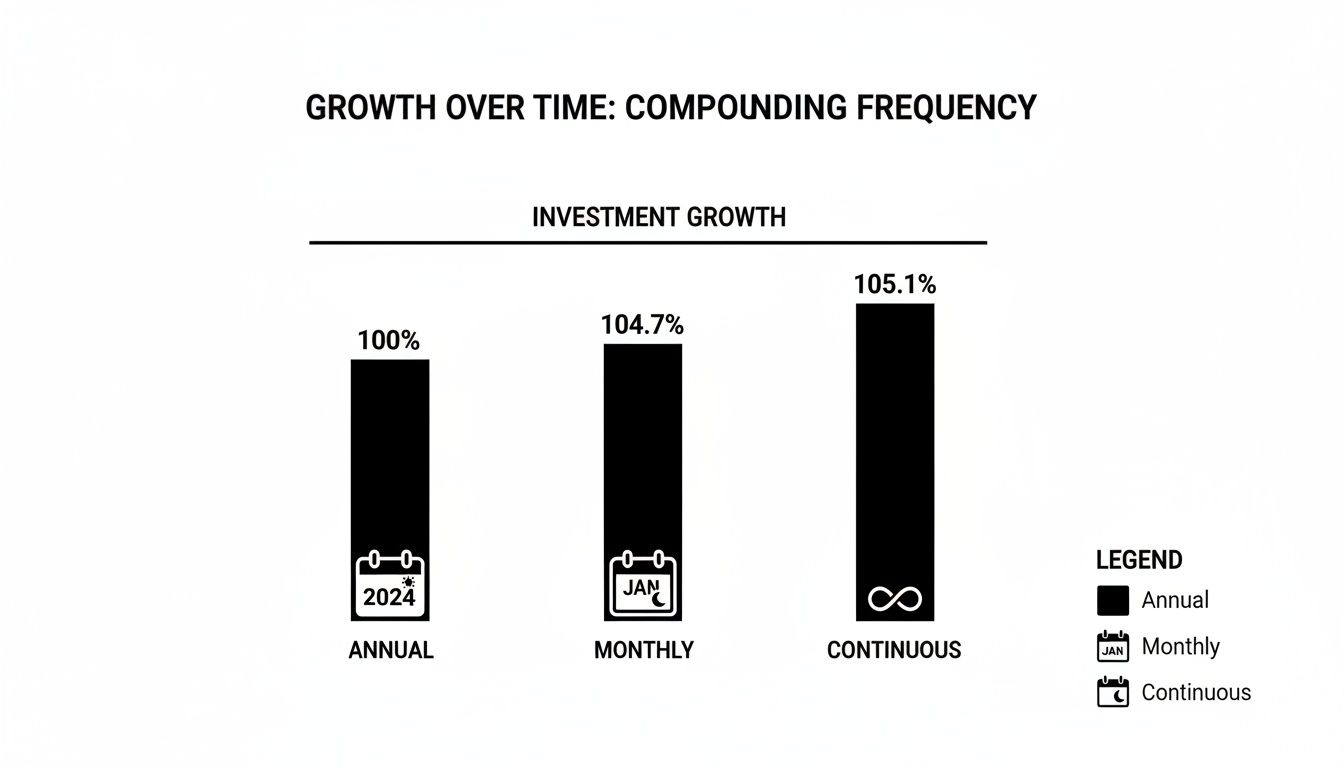
Comparing Compounding Frequencies And Real Impact
Even when the annual rate stays at 5%, the final amount shifts noticeably depending on how often interest gets added. Over a decade, $10,000 can grow to $16,289 with once-a-year compounding. Switch to monthly, and you’ll see about $16,470. Push it to continuous compounding, and that creep reaches $16,487.
Banks often quote semiannual or quarterly schedules. In this same example, compounding twice a year results in $16,330, while four times a year bumps it to $16,365. Daily compounding slots in just under monthly—right around $16,487—showing how more frequent additions gradually nudge your total upward.
Impact Of Compounding Frequency
Below is a quick comparison of formulas and end balances after ten years at 5%:
Take a quick look at how these intervals stack up:
| Frequency | Formula | Outcome |
|---|---|---|
| Annual | A = P (1 + r)ᵗ | $16,289 |
| Semiannual | A = P (1 + r/2)^(2t) | $16,330 |
| Quarterly | A = P (1 + r/4)^(4t) | $16,365 |
| Monthly | A = P (1 + r/12)^(12t) | $16,470 |
| Daily | A = P (1 + r/365)^(365t) | $16,487 |
| Continuous | A = P × e^(rt) | $16,488 |
Even though continuous compounding represents a theoretical cap, you can handle daily or continuous models with most financial calculators and spreadsheet functions.
Historical Perspective On Compound Returns
To appreciate compounding’s long-term power, consider this: a single £1 invested in the U.S. stock market in 1900 would have grown to about £3,703 by today at a 6.9% real annual return. The same stake in the U.K. stock market, at 4.8%, would be only £341. Australia’s 6.4% real return, meanwhile, turns that pound into roughly £2,134 over 124 years. For more on these figures, check out this global market returns data.
“Compound interest turns modest savings into fortunes when you let time do the work.”
Key takeaways from these charts and real examples:
- Higher compounding frequency yields slightly better effective rates
- A small gap in annual returns multiplies massively over decades
- Spreadsheets or in-browser calculators effortlessly model daily and continuous compounding
- Always weigh any extra fees or minimum balances against the marginal gains
- Choosing monthly compounding often hits the sweet spot for everyday savings; go continuous for advanced projections
At the end of the day, compounding always operates on principal plus accrued interest. Make sure your tools track each period correctly so you can plan with confidence.
Common Mistakes To Avoid When Projecting Growth
Forecasting growth with compound interest is deceptively simple—and it’s all too easy to slip up. Mix up a nominal rate with a real rate, and your projections can drift far from reality. Remember, nominal figures skip over inflation, while real rates adjust for your money’s true buying power.
- Mismatched Units derail calculations. Always align time periods—years, months or days—before you plug in numbers.
- Unconverted Percentages turn 0.05 into 5 if you forget the decimal, blowing results out of scale.
- Ignored Cash Flows hide regular withdrawals or extra deposits, skewing your ending balance.
Input Validation Checks
A quick sanity check on your inputs can save countless headaches. Modern spreadsheets offer built-in data validation and error checking—use them.
A quick glance at mismatched units once saved me from a 20% overestimate.
It pays to verify that every rate is in decimal form (for example, 5% as 0.05) and that your compounding frequency matches the period you’ve chosen.
Interpreting Results Critically
Numbers don’t lie—but they can mislead you if you take them at face value. Always run a simple benchmark alongside your detailed model.
- Compare your doubling time with the Rule of 72 to catch major anomalies.
- Check that extra contributions actually boost the balance.
- Make sure periodic withdrawals reduce the final amount.
- Watch rounding: shifts larger than 0.1% can indicate a deeper formula issue.
I’ve seen a stray zero inflate a forecast by 10×. Don’t let a tiny typo derail your entire analysis.
Quick Review Strategies
Before wrapping up, give your spreadsheet a fast yet focused audit:
- Scan formulas for missing parentheses or misplaced cell references
- Confirm that n (compounding periods) and t (time) use the same units
- Apply color-coded highlights to group inputs, calculations and outputs
A second glance often catches what hours of work missed.
Invite a colleague to review your work or share your sheet via ShiftShift Extensions for fresh perspectives. Regularly update your templates and validation rules to keep future forecasts airtight.
Practical Tips
- Double-check inflation assumptions against the latest CPI data.
- Automate repetitive checks with ShiftShift Extensions' Compound Interest Calculator to cut down on manual mistakes.
- Maintain a clear version history so you can roll back if new errors crop up.
The sooner you spot a discrepancy, the more confidence you’ll have in your numbers.
FAQ On Calculating Compound Interest
One question I hear all the time is how to deal with interest rates that change halfway through an investment. The trick is to chop your timeline into segments and apply the compound formula to each slice.
Imagine you lock in a 5-year investment earning 4% for the first 2 years and 6% for the next 3 years. You’d first calculate:
A₁ = P × (1 + 0.04)²
Then use A₁ as your new principal:
A₂ = A₁ × (1 + 0.06)³
Multiply those results and you’ve got your final amount. It sounds like extra work, but once you see it laid out in a spreadsheet, every piece clicks into place.
Regular contributions are a bit different—they behave like a series of cash flows. To handle those, you’ll lean on the future value of an annuity. Keep these points in mind:
- Use the future value of an annuity formula when you make steady deposits
- Match your interest rate and compounding frequency exactly
- Decide if deposits occur at the beginning or end of each period
For investors wanting the theoretical maximum return, continuous compounding steps in with A = P e^(r t). It replaces the usual discrete formula when you assume interest is credited an infinite number of times.
Discrete Versus Continuous Compounding
Discrete compounding credits interest at regular intervals—monthly, quarterly or yearly. Each credit event nudges your balance up a bit, boosting overall returns when you compound more often.
Continuous compounding takes that idea to its limit, adding interest an infinite number of times. In practice, it delivers the highest possible outcome for a set rate and term.
Continuous compounding gives a small additional edge once frequencies exceed daily additions.
Knowing which method your bank or calculator uses will save you headaches when comparing offers. Always double-check that setting in your spreadsheet or financial tool.
Handling Zero And Negative Rates
Rates at or below zero can feel counterintuitive, but the math is straightforward. With r = 0, your balance never changes—A stays equal to P. Negative rates shrink your balance each period, illustrating how charges eat away at your capital.
- At a –2% annual rate, your balance falls by 2% every year.
- If you switch to monthly compounding, each period applies r/n = –0.02/12, so losses accelerate with more frequent intervals.
Watch out for hidden fees presented as negative rates. Always plug in the net rate after fees to avoid surprises.
Most online calculators let you enter negative numbers—just confirm the tool shows A < P when r is under zero. This quick sanity check ensures your projections stay on track.
Ready to streamline your calculations? Try the Compound Interest Calculator in ShiftShift Extensions. Model rates, frequencies and regular contributions without leaving your browser.
Article created using Outrank