How to Calculate Investment Returns for Smarter Gains
Learn how to calculate investment returns with practical advice. This guide covers CAGR, IRR, and total return to help you measure portfolio performance.
Sambungan Disyorkan
Before you can run the numbers on your investments, you have to know what you’re actually measuring. Getting a true sense of your return isn't just about how much an asset's price went up or down. It's about capturing the total performance, which includes any cash it threw off along the way, like dividends or interest.
What Does an Investment Return Actually Mean?
Let's cut through the jargon. At its heart, an "investment return" is simply the money you made or lost. But honestly, that’s too simple. A real understanding goes much deeper than just watching a stock ticker.
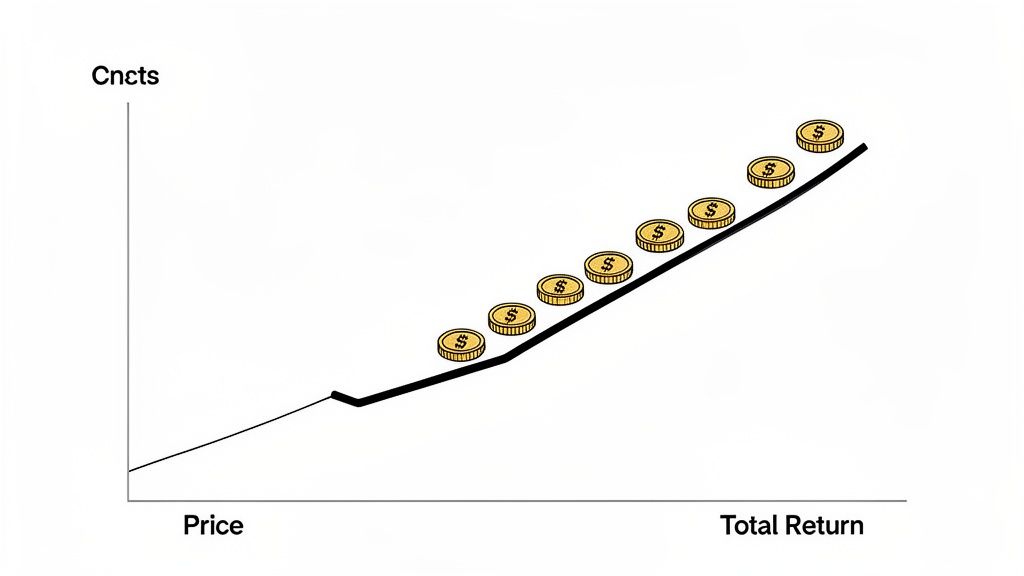
A classic rookie mistake is fixating only on capital appreciation—did the price go up? While that's obviously important, it's only half the story. The metric that really matters is Total Return, because it gives you the complete picture of how your money performed.
It's More Than Just a Price Change
Let's walk through a quick, real-world example. Say you bought 100 shares of a big tech company at $150 a share. Your total initial investment is $15,000. A year goes by, and the stock is now trading at $160. Your shares are worth $16,000.
If you only look at the price, you'd say you have a $1,000 gain. Not bad, but it's an incomplete picture.
Many solid companies pay dividends, sharing a slice of their profits with you, the shareholder. What if this company paid out $2 per share in dividends over that year? With your 100 shares, that’s an extra $200 in cash that landed in your account. That income is a direct result of your investment, and it absolutely has to be counted.
Your real gain isn't just the price increase; it's the price increase plus any income you earned along the way. Ignoring dividends is like getting paid for a job but forgetting to count your bonus.
Why Total Return Is King
When you factor in that dividend income, your actual gain is $1,200 (the $1,000 price jump + the $200 in dividends). This is your Total Return, and it's the only number that gives you an honest accounting of what your investment truly generated.
Getting this right is crucial for a few reasons:
- Honest Report Card: It tells you how your investment actually performed, with no sugar-coating.
- Smarter Decisions: When you’re comparing two different investments, Total Return allows for a true apples-to-apples comparison. A stock with slower growth but a hefty dividend can easily outperform a flashy growth stock that pays nothing.
- Hitting Your Goals: Knowing your real returns is the only way to know if you're on track to hit your financial goals, whether that's retiring early or saving for a house.
One-Time Gain vs. Long-Term Compounding
That $1,200 gain is a great snapshot of your return over one year. But the real magic, the secret to building serious wealth, is what you do with it next. This is where compounding comes in.
If you reinvest that $200 dividend by buying more shares, your investment base gets bigger. The following year, you’ll earn dividends on your original 100 shares plus the new ones you just bought. This is compounding in action: your money starts making money, and then the money it makes starts making more money.
Understanding this concept is everything. The calculations we're about to explore—from simple returns to more complex metrics like CAGR—are all just tools to measure the powerful effect of compounding over time. They let you see exactly how small, steady gains can snowball into significant wealth.
Calculating Your Portfolio's Total Return
Now that we’ve covered why Total Return is the gold standard for measuring performance, let's get our hands dirty and actually run the numbers. These formulas aren’t just for Wall Street quants; they're essential tools for any serious investor who wants a clear picture of how their money is working for them.
The most common starting point is the Simple Return. It’s quick, easy, and gives you a snapshot of an asset's price change. Think of it as the headline number.
The formula couldn't be more straightforward:
Simple Return = (Current Value – Initial Value) / Initial Value
So, if you bought a stock for $1,000 and it’s now worth $1,150, your simple return is ($1,150 - $1,000) / $1,000. That comes out to 0.15, or a solid 15% gain. But there's a huge catch: this calculation is blind to any income the investment paid out, like dividends or interest.
Capturing the Full Picture With Total Return
To get a truly accurate measure of your investment's performance, you need to use the Total Return formula. This is where you account for everything—not just the change in price, but also any cash your investment put back into your pocket.
Here’s the formula that tells the whole story:
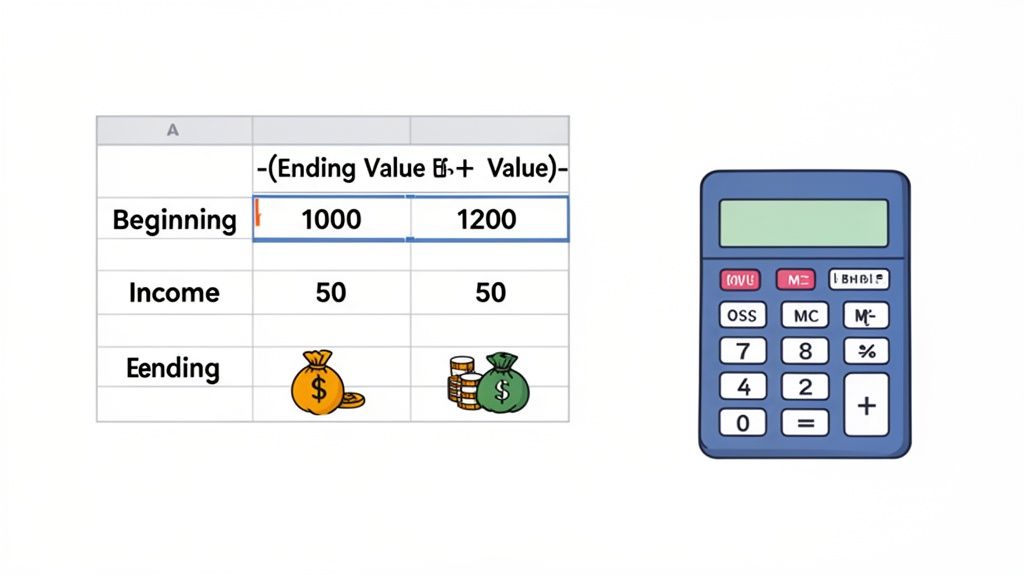
Total Return = (Ending Value + Income – Beginning Value) / Beginning Value
This is the number that matters. It combines capital appreciation with the income you earned, giving you an honest report card on your investment. If you're managing multiple assets and want a deeper look at the methods involved, this guide on how to calculate portfolio returns accurately is a great resource.
Let's see how this plays out with a real-world example.
A Practical Example of Total Return in Action
Imagine you invested $5,000 in a dividend-paying stock. After a year, the stock’s market value has climbed to $5,300. On top of that, you received $150 in dividends throughout the year.
Here's how the two methods stack up:
Calculating Simple Return:
- Formula: ($5,300 - $5,000) / $5,000 = 0.06
- Result: A 6% return. Not bad, but incomplete.
Calculating Total Return:
- Formula: ($5,300 + $150 - $5,000) / $5,000 = 0.09
- Result: A 9% return. That’s the real number.
That 3% difference isn't just a rounding error; it's a significant chunk of your earnings. By ignoring the dividends, you'd be selling your investment's performance short.
Simple Return vs Total Return A Clear Comparison
This table really drives home the difference between looking at just the price change versus the complete financial picture.
| Metric | Simple Return Calculation | Total Return Calculation | Impact |
|---|---|---|---|
| Components | Price change only (Capital Appreciation) | Price change + Income (Dividends, Interest) | Total Return provides a complete, honest view of performance. |
| Formula | (Ending - Beginning) / Beginning |
(Ending + Income - Beginning) / Beginning |
The addition of "Income" is the game-changer. |
| Our Example | ($5,300 - $5,000) / $5,000 = 6% | ($5,300 + $150 - $5,000) / $5,000 = 9% | The simple return understated the actual gain by 3%. |
As you can see, relying solely on simple return can be misleading, especially for investments designed to generate income.
Using Spreadsheets to Make It Easy
Doing this math by hand is fine for one or two investments, but once you have a full portfolio, a spreadsheet becomes your best friend. Both Google Sheets and Microsoft Excel are perfect for this.
You can plug the Total Return formula directly into a cell:
=(Ending Value + Income - Beginning Value) / Beginning Value
Let's map this to a spreadsheet. Imagine you have your data in these cells:
- Cell A2: Beginning Value ($5,000)
- Cell B2: Ending Value ($5,300)
- Cell C2: Income ($150)
Just type = (B2 + C2 - A2) / A2 into another cell, say D2.
Hit Enter, and you’ll see 0.09. From there, just format the cell to display as a percentage, and you'll get 9.00%. This simple setup lets you track everything in one place, giving you a powerful and consistent way to see how your portfolio is really doing.
Using CAGR to Measure Long-Term Performance
When you're looking at your investment performance over a single year, the Total Return formula works just fine. But what about when you want to see how you've done over three, five, or even ten years?
This is where a simple average of yearly returns can get you into trouble. It completely ignores the power of compounding, which is the engine of long-term growth. To get a real sense of your performance over time, the Compound Annual Growth Rate (CAGR) is the metric you need to know.
CAGR smooths out the bumps. It gives you a single, annualized growth rate that shows what your investment would have returned each year if it had grown at a perfectly steady pace. It cuts through the noise of market volatility—all those ups and downs—and gives you one number that reflects your true long-term performance.
Think of it this way: CAGR answers the question, "What steady, year-over-year return would I have needed to get from my starting investment to my final amount?"
Why Simple Averages Just Don't Cut It
Let’s see why a simple average can be so misleading. Imagine you had an investment with these annual returns:
- Year 1: +20%
- Year 2: +10%
- Year 3: -15%
A simple average gives you (20 + 10 - 15) / 3 = 5%. But that number is a fantasy—it doesn't reflect what actually happened to your money because it ignores how each year's performance builds on the last.
This distinction is absolutely crucial for understanding how wealth is actually built. If you're interested in the mechanics behind this, our guide on how to calculate compound interest provides a great breakdown of the core principles.
You'll often hear about the average annual return of major indexes, which is usually a simple arithmetic average. For example, since its start in 1928, the S&P 500 has delivered an average annual return of around 8.55% (including dividends). Researchers get this by adding up each year's return and dividing. While that's useful for historical context, CAGR is what you need to accurately model your own portfolio's journey.
Breaking Down the CAGR Formula
The formula for CAGR might look a little intimidating at first glance, but it's really quite simple. It only needs three pieces of information: the beginning value, the ending value, and the number of years.
Here’s the formula:
CAGR = [(Ending Value / Beginning Value)^(1 / Number of Years)] - 1
Let's walk through a real-world example to see it in action.
Say you invested $10,000 into a mutual fund. Five years later, that investment has grown to $16,105.
Here are our inputs:
- Beginning Value: $10,000
- Ending Value: $16,105
- Number of Years: 5
Now, let's plug those numbers into the formula step-by-step:
- First, divide the Ending Value by the Beginning Value: $16,105 / $10,000 = 1.6105
- Next, calculate the exponent: 1 / 5 years = 0.2
- Raise the result from step 1 to the power of that exponent: 1.6105 ^ 0.2 = 1.10
- Finally, subtract 1 from that result: 1.10 - 1 = 0.10
Convert that decimal to a percentage, and you get a CAGR of 10%. This means your $10,000 grew as if it earned a steady 10% every single year for five years, even though the actual returns likely jumped around.
How to Calculate CAGR in a Spreadsheet
Doing the math by hand is a great way to understand the concept, but for day-to-day use, a spreadsheet is your best friend. Both Google Sheets and Excel make this incredibly easy.
Method 1: The Direct Formula
You can just type the CAGR formula directly into a cell. Let’s say you have your data set up like this:
- Cell A2: Beginning Value ($10,000)
- Cell B2: Ending Value ($16,105)
- Cell C2: Number of Years (5)
The formula would be: =(B2/A2)^(1/C2)-1
Press enter, and you’ll see 0.10. Just format the cell as a percentage to display 10%.
Method 2: The RATE Function
An even cleaner approach is to use the built-in RATE function, which is designed for exactly this kind of calculation. The syntax is RATE(nper, pmt, pv, [fv]).
Here’s what each part means for our example:
- nper: Number of periods (C2, or 5 years)
- pmt: Payment per period (use 0, since you aren't making regular deposits)
- pv: Present value (your starting amount, entered as a negative: -A2)
- fv: Future value (your ending amount: B2)
The full formula in your spreadsheet would look like this: =RATE(C2, 0, -A2, B2)
Both methods get you the same 10% CAGR. This is a must-know metric for comparing different investments over the same timeframe, as it gives you a standardized, apples-to-apples measure of performance. If you want to dive deeper into this key metric, you can learn more about the Compound Annual Growth Rate (CAGR).
How IRR Accounts for Your Real-World Decisions
CAGR is a fantastic metric, but it operates in a perfect world—one where you make a single investment and then don't touch it for years. That’s just not how most of us invest.
We add money when we get paid, reinvest dividends, and maybe pull some cash out for a big expense. Every one of these moves is a cash flow, and each one nudges your final return up or down. For a portfolio that's alive with activity, CAGR simply can't keep up. You need a tool that reflects your actual decisions, and that’s precisely what the Internal Rate of Return (IRR) does.
IRR is a more sophisticated way of looking at your performance because it takes the timing and size of every single deposit and withdrawal into account. It calculates a "money-weighted" return, giving you the annualized rate you earned based on your specific activity. It's your truly personalized performance score.
When Your Timing Makes All the Difference
Think about this: two people invest in the exact same fund, which has the exact same annual returns. Investor A gets lucky and adds a big chunk of cash right before the market soars. Investor B adds the same amount right before a dip.
Even though the fund's performance was identical for both, Investor A's personal return will be significantly higher. Why? Better timing. IRR is the only metric that truly captures that nuance.
This is why understanding IRR is so critical for benchmarking your own portfolio. When you measure your performance against a broad market index, you're usually comparing your time-weighted return (which ignores cash flow timing) against the index's returns. But to know how your decisions paid off, you need a money-weighted return—you need IRR. This is especially true if you added or withdrew money throughout the year.
If you're ever unsure which metric to use, this flowchart can help point you in the right direction.
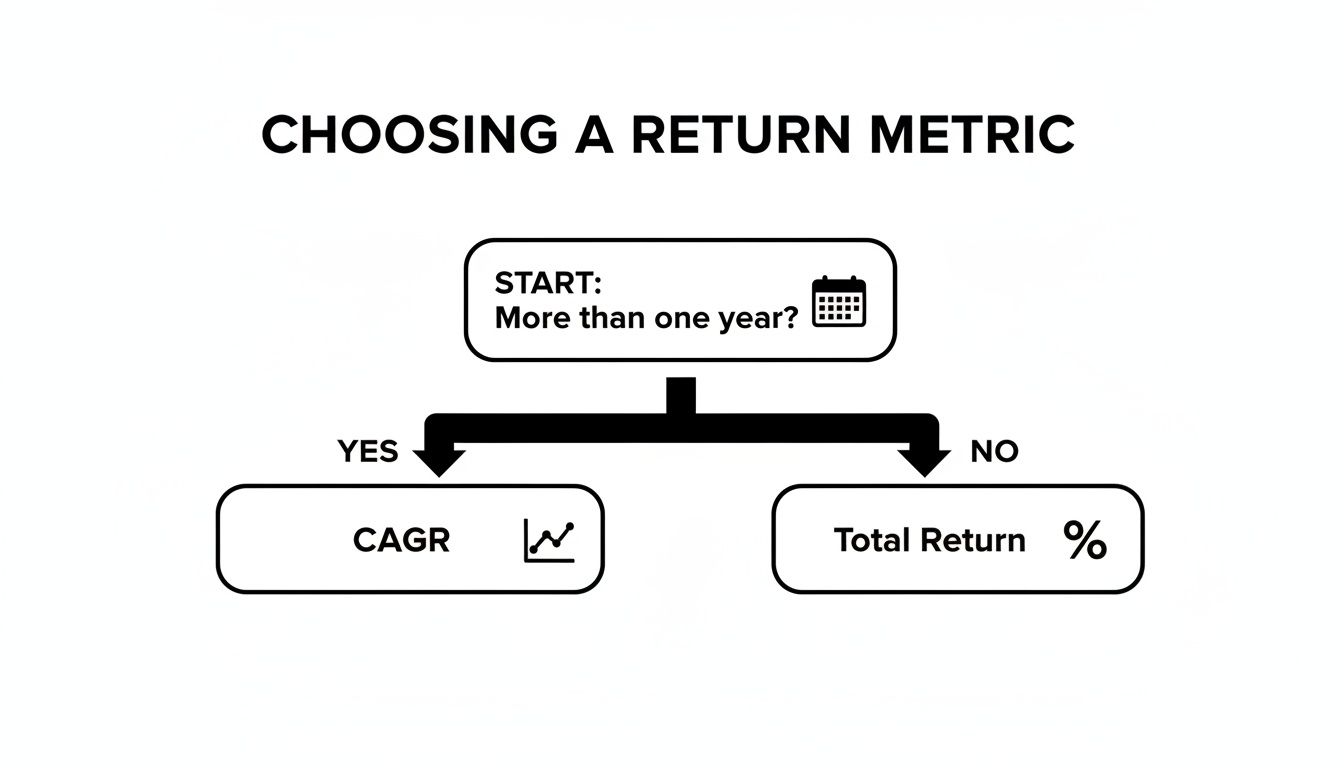
As you can see, for investments held over several years with no cash in or out, CAGR is your go-to. For shorter-term holds, Total Return works well. But the moment you start adding or withdrawing funds, IRR becomes the most accurate measure of your personal success.
Calculating IRR in a Spreadsheet: A Real-World Scenario
Let’s be honest, calculating IRR by hand is a nightmare. It involves complex trial-and-error algebra that nobody has time for. Thankfully, we have spreadsheets.
Let's walk through a common scenario. An investor kicks off the year with $10,000 in her account and adds more money periodically. By year-end, the account is worth $13,500.
Here's the breakdown of her activity:
- January 1: Initial Investment (-$10,000)
- April 1: Added Funds (-$1,000)
- July 1: Added Funds (-$1,500)
- December 31: Ending Market Value (+$13,500)
One quick but crucial thing to notice: all contributions (money going in) are negative, while the final value (money you could take out) is positive. Spreadsheets need the data formatted this way to work correctly.
Pro Tip: Always list your cash flows chronologically. Start with the initial investment, list all contributions and withdrawals in order, and finish with the final market value on the closing date.
Using the XIRR Function for Precision
Because our investor's contributions didn't happen on a neat monthly or annual schedule, the best tool for the job in Google Sheets or Excel is the XIRR function. It's built specifically for cash flows occurring at irregular intervals.
Setting it up is simple.
- Put the dates of each transaction in one column (e.g., Column A).
- Put the corresponding cash flow amounts in the next column (Column B). Remember to use negative signs for all money you put in.
Here’s what it looks like in a table:
| Date (Column A) | Cash Flow (Column B) |
|---|---|
| 2023-01-01 | -10000 |
| 2023-04-01 | -1000 |
| 2023-07-01 | -1500 |
| 2023-12-31 | 13500 |
Assuming your dates are in cells A2:A5 and the cash flows are in B2:B5, the formula is just:
=XIRR(B2:B5, A2:A5)
Hit enter, and you get 14.89%. This is the investor's personalized, annualized internal rate of return. It's the true measure of her performance, factoring in not just what she invested, but when. That’s the real power of IRR.
Seeing the Future: Quick Tools for Visualizing Growth
Formulas like CAGR and IRR are fantastic for dissecting your past performance. But let's be honest—sometimes, what you really need is a clear picture of your future to stay motivated. Spreadsheets are workhorses for detailed analysis, but for quick, "what-if" scenarios, a good in-browser calculator is your best friend. They instantly turn a bunch of numbers into a powerful visual story about compound growth.
Think of these tools as your financial sandbox. You can play around with different scenarios—what if I add an extra $50 a month? What happens if I invest for just five more years?—without having to build a single spreadsheet formula. It’s less about analyzing history and all about charting a course for where you want to go.
A Walkthrough: The ShiftShift Compound Interest Calculator
Let's grab a simple but effective tool, the ShiftShift Compound Interest Calculator, to see this in action. The goal here isn't just to get a final number. We want to see how the money you put in compares to the money your money earns over time. That visual separation is where the magic happens.
To get going, you only need a few pieces of information:
- Initial Investment: The lump sum you're starting with.
- Monthly Contribution: The amount you'll consistently add.
- Interest Rate: Your best guess for the annual return.
- Time Period: How many years you plan to let it grow.
You plug in those numbers, and the calculator instantly generates a chart showing your potential growth trajectory.
Here’s a look at the calculator modeling an investment with regular monthly top-ups.
The most compelling part is right there in the colors. The blue area represents your Total Contributions—the hard-earned cash you’ve put in. The green area shows the Total Interest. You can literally see the tipping point where your earnings start to do more of the heavy lifting than your deposits. That’s compounding made visible.
How to Read the Results
The real insight from these charts isn't the final number at the top right; it's understanding the story of how you get there.
In the beginning, your portfolio's value is almost all blue—it's mostly the money you've contributed. But stick with it. As the years roll by, you’ll see the green "interest" section start to swell, getting bigger and bigger until it eventually towers over the blue.
For many investors, the "aha!" moment is seeing their investment earnings finally overtake their personal savings. It’s when compounding stops being a textbook term and becomes a real, motivating force for your financial goals.
This kind of visualization makes it incredibly easy to see the impact of small tweaks. What if you bump up your monthly contribution by $100? What if you can squeeze out an average return of 8% instead of 7%? Just slide the numbers and watch the chart redraw itself. Suddenly, you're not just planning with numbers; you're building a plan based on a clear, visual picture of what’s possible.
The Hidden Costs That Reduce Your Actual Gains
Getting that first number—your total return or CAGR—feels great. But here's the hard truth: it’s not what actually lands in your pocket. To get an honest look at how you're doing, you have to account for the real-world costs that are constantly working against your portfolio.
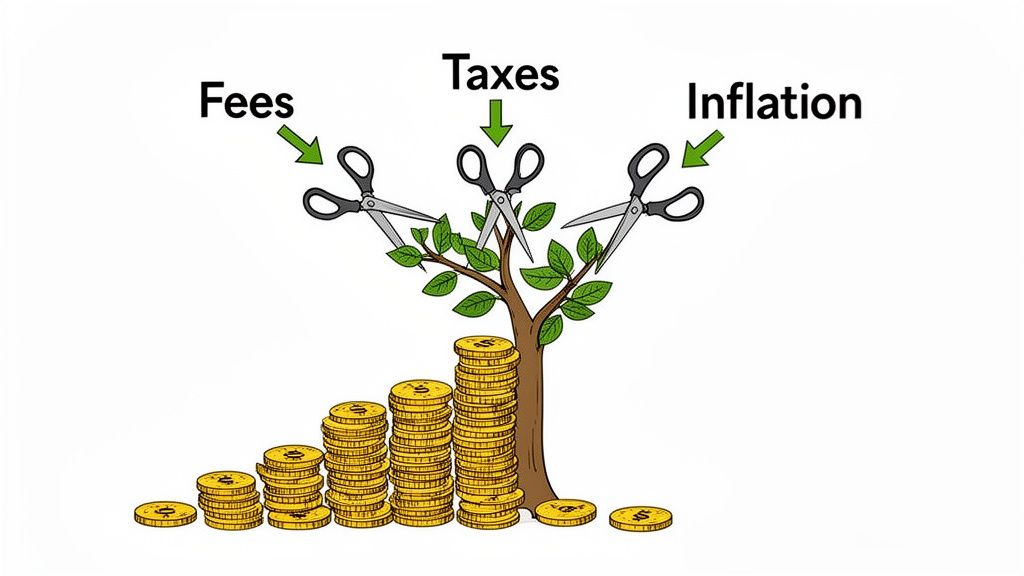
Think of your gross return as the starting line. From there, three big players—fees, taxes, and inflation—start taking their cut. The only way to know if your money is really growing is to figure out your return after these costs have done their work.
The Slow Burn of Investment Fees
Investment fees are deceptively small. They’re often quoted as a tiny percentage, but their long-term impact can be absolutely massive. A common one you'll see is the management expense ratio (MER) for mutual funds and ETFs, which can easily be 1% or more every single year.
Now, 1% might sound harmless, but that's a percentage of your entire portfolio, not just your gains for the year.
Let’s say your portfolio grows by 7%. A 1% fee doesn’t just knock your gain down to 6%. It actually eats up over 14% of your profits for that year. Over decades, that seemingly small fee can quietly consume a third or more of what you could have earned, all thanks to lost compounding.
Don't underestimate the destructive power of fees. A small percentage paid year after year can be the single biggest obstacle between you and your financial goals. Always favor low-cost index funds or ETFs when possible.
Understanding Your Tax Burden
Taxes are another unavoidable drag on your real returns, and the government is always waiting for its share. How much you owe depends heavily on your timeline.
- Short-Term Capital Gains: Sell an asset you’ve held for a year or less, and your profit gets taxed at your ordinary income tax rate. That’s the highest rate you pay.
- Long-Term Capital Gains: Hold that same asset for more than a year, and you qualify for a much lower tax rate. This is a huge incentive to think and act like a long-term investor.
This is where strategic tax planning comes in. Using tax-advantaged accounts like a 401(k) or an IRA can dramatically shrink this burden and seriously boost your net returns over your lifetime.
Inflation: The Silent Wealth Killer
Finally, we have to talk about inflation—the steady rise in the cost of everything, which quietly erodes the buying power of your money. If your investments return 8% but inflation is running at 3%, your real return is only 5%. This is the number that truly matters because it tells you if you're actually getting ahead.
The historical impact here is staggering. Over the last century, the S&P 500 has posted a strong nominal return of around 10.46% per year with dividends. But after you adjust for inflation, some studies show the U.S. real stock return was closer to 4.73% per year. You can dig into more of this historical data on average stock market returns.
To figure out your own real return, you can use this simple formula:
Real Return = [(1 + Nominal Return) / (1 + Inflation Rate)] - 1
So, for that 8% return with 3% inflation, the math looks like this: [(1.08 / 1.03)] - 1. That gives you 0.0485, or a 4.85% real return. This is the only figure that tells you if you're truly getting richer.
Common Questions About Investment Returns
Let's tackle a few of the questions that almost always come up when investors start getting serious about tracking their performance. Getting these concepts down is a huge step toward really understanding how your money is working for you.
What’s Considered a “Good” Return on Investment?
This is the million-dollar question, isn't it? The honest answer is: it depends entirely on you. A "good" return is completely relative to your financial goals, how much risk you're willing to take on, and what the market is doing at the moment.
Lots of people throw around the historical average of the S&P 500, which sits around 10% per year, as a universal benchmark. But that's just a yardstick. For some, beating that is the goal. For others, who might be closer to retirement, a lower but more stable return is far "better" because it protects their capital.
A good return is simply one that keeps you on pace to hit your goals after you’ve accounted for the real-world drags of fees and inflation.
How Often Should I Be Checking My Returns?
If you're investing for the long haul, looking at your portfolio's performance every day is a recipe for anxiety. It's so easy to get spooked by short-term market noise and make a rash decision you'll later regret. My advice? Zoom out.
A quarterly or semi-annual review is a great rhythm to get into. That’s enough time to see real trends emerge without getting caught up in the daily drama. At the very least, a deep dive once a year is non-negotiable to make sure your strategy is still sound and on track.
What's the Real Difference Between IRR and CAGR?
This is a common point of confusion, but it's a critical one to get right because using the wrong metric can give you a completely skewed picture of your performance. It all comes down to how you invest.
CAGR (Compound Annual Growth Rate) works perfectly if you made a single, one-time investment and haven't added or withdrawn any money since. It essentially smooths out the year-to-year bumps to give you a clean average annual growth rate.
IRR (Internal Rate of Return) is built for the real world, where most of us are regularly adding money to our accounts. It's a more sophisticated calculation that takes into account the timing and amount of all your contributions and withdrawals. If you're an active investor, IRR is the number that truly reflects your personal return.
Ready to stop guessing and start visualizing your financial future? The ShiftShift Extensions suite includes a powerful Compound Interest Calculator that turns complex projections into simple, interactive charts. See your potential growth, model different scenarios, and take control of your investment planning right from your browser. Download ShiftShift Extensions for free and start planning smarter today.