Kaip išmatuoti tinklo delsą: praktinis vadovas programuotojams
Sužinokite, kaip išmatuoti tinklo vėlavimą su šiuo išsamiu vadovu. Aptariame esminius įrankius, tokius kaip ping ir traceroute, bei naršyklėje pagrįstas testavimo technikas.

Rekomenduojamos plėtiniai
Norite išmatuoti tinklo vėlavimą? Galite pradėti nuo paprastų, įmontuotų komandinės eilutės įrankių, tokių kaip ping ir traceroute, kad greitai sužinotumėte Round-Trip Time (RTT). Arba galite atidaryti naršyklės kūrėjo įrankius, kad pamatytumėte, kaip vėlavimai veikia tai, ką iš tikrųjų patiria jūsų vartotojai.
Šios metodikos suteikia greitą, naudingą vaizdą apie tai, kiek laiko užtrunka duomenų paketo kelionė nuo šaltinio iki paskirties ir atgal.
Kodėl vėlavimo matavimas yra neatsiejamas
Prieš pereinant prie „kaip“, pakalbėkime apie „kodėl“. Programuotojams ir tinklo inžinieriams vėlavimas nėra tik skaičius ekrane; tai nematoma ranka, formuojanti visą vartotojo patirtį. Šiandienos programose milisekundės yra viskas. Net ir menkas vėlavimas gali būti skirtumas tarp paslaugos, kuri atrodo akimirksniu, ir tos, kuri atrodo sugedusi.
Pagalvokite apie realaus pasaulio pasekmes:
- API atsakas: Vienas lėtas API skambutis gali sukelti domino efektą, sustabdydamas viską, pradedant vartotojo profilio įkėlimu ir baigiant kritinio mokėjimo apdorojimu.
- Realaus laiko duomenų srautai: Internetiniams žaidimams, gyvam vaizdo įrašui ar finansiniam prekybai, žemas ir nuoseklus vėlavimas yra absoliuti pagrindas. Be jo, šios programos tiesiog neveikia.
- Vartotojų išlaikymas: Yra tiesioginis ryšys tarp lėtai įkeliamos svetainės ir programų bei didesnių atmetimo rodiklių ir apleistų pirkinių krepšelių. Tai smarkiai paveikia pelną.
Pagrindinių vėlavimo sąvokų atskyrimas
Norint tiksliai išmatuoti tinklo vėlavimą, reikia žinoti, ką žiūrite. Dvi pagrindinės sąvokos yra Round-Trip Time (RTT) ir vienpusis vėlavimas.
RTT yra bendras laikas, per kurį signalas keliauja nuo A taško iki B taško ir atgal. Tai yra dažniausiai matuojama metrika, nes ją lengva išmatuoti – jums reikia tik prieigos prie vieno ryšio galo.
Vienpusis vėlavimas, kaip rodo pavadinimas, matuoja laiką, per kurį duomenys keliauja tik viena kryptimi. Tai yra daug sudėtingesnis matavimas, nes reikalauja tobulai sinchronizuotų laikrodžių abiejuose galuose. Tačiau tai yra daug tikslesnis rodiklis asimetriniams ryšiams, kur jūsų įkėlimo ir atsisiuntimo keliai elgiasi labai skirtingai.
Viso to svarba tampa akivaizdi, kai atliekate rimtą apkrovos našumo testavimą, kur teorija susitinka su realybe ir atskleidžiami siaurėjimai.
Norint pateikti skaičius, tinklo stebėjimo ekspertai paprastai klasifikuoja vėlavimą taip:
- Žemas vėlavimas: Po 50 milisekundžių
- Vidutinis vėlavimas: 50-150 ms
- Aukštas vėlavimas: Virš 150 ms
Iš mano patirties, greitas testas į artimą serverį gali parodyti visiškai priimtiną 20-40 ms. Tačiau tas skaičius gali lengvai išaugti iki daugiau nei 200 ms srautui, kuris turi kirsti vandenyną, kas gali tapti lemiamu veiksniu jūsų programos našumui.
Norint suprasti terminologiją, su kuria susidursite, pateikiama greita nuoroda.
Pagrindinės vėlavimo sąvokos akies krašteliu
| Sąvoka | Ką ji matuoja | Kodėl tai svarbu |
|---|---|---|
| Vėlavimas (Ping) | Laikas, per kurį vienas duomenų paketas keliauja nuo šaltinio iki paskirties ir atgal. Matuojama milisekundėmis (ms). | Tai yra grynas vėlavimo matas. Žemas vėlavimas yra labai svarbus realaus laiko programoms, tokioms kaip žaidimai, VoIP ir vaizdo konferencijos. |
| Round-Trip Time (RTT) | Iš esmės tas pats, kas vėlavimas, tai yra bendras laikas, per kurį signalas siunčiamas, plius laikas, per kurį gaunamas patvirtinimas. | RTT yra dažniausiai naudojamas ir praktiškas būdas matuoti vėlavimą iš vieno taško, todėl tai yra pagrindinė metrika tokiems įrankiams kaip ping. |
| Vienpusis vėlavimas | Laikas, per kurį paketas keliauja nuo šaltinio iki paskirties viena kryptimi. | Suteikia detalesnį vaizdą, ypač asimetriniuose tinkluose, kur įkėlimo ir atsisiuntimo keliai turi skirtingus vėlavimus. |
| Jitter | Vėlavimo svyravimas per laiką. Matuoja paketo atvykimo laikų nuoseklumą. | Aukštas jitter yra toks pat blogas kaip ir aukštas vėlavimas transliuojant medijas ir internetu vykstant skambučiuose, sukeldamas strigimą, buferizavimą ir trukdžius. |
| Juostos plotis | Maksimalus duomenų kiekis, kuris gali būti perduotas per tinklo ryšį per tam tikrą laiką. Matuojama Mbps arba Gbps. | Dažnai painiojama su greičiu, juostos plotis yra apie talpą. Galite turėti didelį juostos plotį, bet vis tiek patirti didelį vėlavimą. |
Šios sąvokos yra statybiniai blokai, skirti suprasti bet kokią tinklo našumo problemą.
Štai kur svarbu turėti prieinamus, integruotus įrankius. Vietoj sudėtingų diagnostikos paketų, šiuolaikinės naršyklių plėtinių ir kūrimo įrankiai gali suteikti jums reikiamų įžvalgų, niekada neišeinant iš jūsų darbo proceso. Tai apie tai, kad vėlavimo matavimas taptų lengvu, kasdieniu proceso dalimi kuriant ir palaikant puikią programinę įrangą.
Pradėkite dirbti su komandinės eilutės vėlavimo įrankiais
Norint tikrai pajusti savo tinklo našumą, turite atidaryti terminalą. Komandinė eilutė yra ta vieta, kur rasite pagrindinius įrankius, kurie suteikia jums grynus, nefiltruotus duomenis apie jūsų ryšį. Tai apie tai, kad pamatytumėte, kas iš tikrųjų vyksta su paketais, judančiais tarp jūsų ir paskirties, ir tai yra esminis pirmas žingsnis bet kuriam programuotojui, rimtai matuojančiam vėlavimą.
Klasikinis, patikimas įrankis yra ping. Jis yra nuostabiai paprastas: jis siunčia mažą duomenų paketą (ICMP echo užklausą) į serverį ir tiesiog laukia, kol jis sugrįš. Tas paprastas važiavimas yra pagrindas Round-Trip Time (RTT) skaičiavimui ir suteikia jums momentinį ryšio sveikatos patikrinimą.
Pirmas vėlavimo patikrinimas su Ping
Vykdyti ping testą negali būti lengviau. Atidarykite terminalą arba komandinę eilutę, įveskite ping ir po to nurodykite domeną, kurį norite išbandyti.
Pagal numatytuosius nustatymus ping veiks amžinai macOS ir Linux, o Windows siunčia tik keturis paketus ir sustoja. Bet kokiai realiai analizei norėsite tai kontroliuoti. Siųsdami dešimt ar dvidešimt paketų, gausite daug patikimesnį ryšio stabilumo vaizdą nei tik keli.
Kai tai bus baigta, gausite tvarkingą santrauką su svarbiais skaičiais:
- Siųsti/Gauti paketai: Tai pasako, ar kelyje buvo prarasta kokių nors duomenų. Net ir nedidelis paketų praradimas yra didelis raudonas signalas tinklo problemoms.
- Round-trip min/avg/max/mdev: Tai yra jūsų pagrindiniai vėlavimo statistiniai duomenys. Jūs gaunate geriausią atvejį (
min), vidurkį (avg) ir blogiausią atvejį (max).mdev(vidutinė nuokrypis) yra jūsų jitter matas – kiek vėlavimas svyruoja nuo vieno paketo iki kito.
Atidžiai stebėkite skirtumą tarp jūsų minimalaus ir maksimalaus RTT. Jei jis platus, jūsų ryšys yra nestabilus, net jei vidurkis atrodo gerai. Šis jitter gali būti daug labiau trikdantis realaus laiko programoms, tokioms kaip vaizdo skambučiai ar žaidimai, nei ryšys, kuris nuolat yra šiek tiek lėtas.
Dažna klaida yra tik žvilgtelėti į vidutinį RTT. Vidurkis 50ms gali atrodyti gerai, tačiau jei jūsų minimumas yra 20ms ir maksimumas 250ms, vartotojo patirtis atrodys trūkčiojanti ir nesaugi. Visada žiūrėkite į visą diapazoną, kad suprastumėte jitter.
Sekite kelią su Traceroute ir MTR
Taigi, ką daryti, kai ping atskleidžia didelį vėlavimą ar paketų praradimą? Jūsų kitas uždavinys yra išsiaiškinti kur yra problema. Tam skirtas traceroute (arba tracert Windows). Jis žemėlapiuoja visą kelią, kurį jūsų paketai keliauja, parodydamas kiekvieną „šuolį“ – kiekvieną maršrutizatorių – tarp jūsų kompiuterio ir galutinės paskirties.
Kiekviena eilutė traceroute išvestyje yra šuolis, ir ji paprastai rodo tris atskirus vėlavimo matavimus iki to taško. Tai leidžia jums nustatyti, ar konkretus maršrutizatorius kelyje sukelia didelį sulėtėjimą ar praranda paketus.
Tačiau traceroute yra vienkartinis vaizdas. Norint gauti dinamiškesnį, nuolatinį vaizdą, dauguma tinklo profesionalų, kuriuos pažįstu, prisiekia MTR (My Traceroute). MTR yra tarsi supercharged įrankis, kuris sujungia ping ir traceroute. Jis nuolat siunčia paketus į kiekvieną šuolį maršrute, suteikdamas jums gyvą, nuolat atnaujinamą vėlavimo ir paketų praradimo vaizdą kiekviename taške. Tai daro jį nepaprastai efektyviu, kad sugautų laikinas problemas, kurių vienas traceroute greičiausiai nepastebėtų.
Kodėl jūsų pasirinkto įrankio svarba
Įrankis, kurį pasirinksite, ir kaip jį sukonfigūruosite, gali drastiškai pakeisti jūsų rezultatus. Tai ypač tiesa ultrahigh, žemo vėlavimo aplinkose, tokiuose kaip debesų duomenų centrai.
Iš tikrųjų tai yra gana akivaizdu, kaip skirtingi skaičiai gali būti. Išsamioje eksperimento, kurį atliko Google Cloud, standartinis ping testas pranešė apie vidutinį RTT 146 mikrosekundžių. Tačiau kai jie naudojo kitą įrankį, kuris siunčia operacijas viena po kitos be pertraukos, RTT sumažėjo iki vos 66.59 mikrosekundžių – daugiau nei du kartus greičiau!
Tai puikus pavyzdys, kodėl ping kartais gali pervertinti vėlavimą. Tai rodo, kad suprasti kaip veikia įrankis yra kritiškai svarbu, norint gauti matavimus, kuriais galite pasitikėti.
Rasti savo ryšio maksimalų greitį su iperf
Vėlavimas ne visada yra visa nuotrauka. Kartais reikia žinoti maksimalų duomenų kiekį, kurį jūsų ryšys iš tikrųjų gali perduoti – jo juostos plotį. Tam įrankis, kurio jums reikia, yra iperf.
Kol ping matuoja vėlavimą, iperf yra visiškai apie pralaidumą. Jis veikia nustatydamas klientų-serverio ryšį ir tada siunčia tiek daug duomenų, kiek gali, tarp jų nustatytą laiką.
Norint naudoti iperf, jums reikės dviejų mašinų:
- Vienoje mašinoje paleiskite
iperfserverio režimu. Jis tiesiog sėdės ir lauks ryšio. - Kitoje mašinoje paleiskite
iperfkliento režimu, nurodydami serverio adresą.
Klientas prisijungs ir testas prasidės. Išvestis parodys bendrą perduotų duomenų kiekį ir, svarbiausia, bitrate (jūsų juostos plotį) megabituose arba gigabituose per sekundę. Tai puikus būdas išbandyti tinklo ryšį ir sužinoti, ką jis iš tikrųjų gali.
Vėlavimo matavimas iš vartotojo perspektyvos
Nors komandinės eilutės įrankiai suteikia jums gryną, nefiltruotą vaizdą apie jūsų tinklą, vienintelis vėlavimas, kuris iš tikrųjų svarbus žiniatinklio programai, yra tai, ką galutinis vartotojas iš tikrųjų patiria. Čia mes perkeliamas dėmesys nuo terminalo į pačią naršyklę. Kas vyksta naršyklėje, pasako daug turtingesnę, labiau aktualią istoriją apie našumą.
Niekuomet nebus kalbama tik apie vieno paketo kelionę. Vartotojo jaučiamas vėlavimas yra sudėtingas kokteilis, sudarytas iš DNS užklausų, TCP rankų paspaudimų, TLS derybų, serverio apdorojimo laiko ir, žinoma, laiko, reikalingo turiniui iš tikrųjų atvaizduoti ekrane. Laimei, šiuolaikinės naršyklės yra aprūpintos galingais įmontuotais įrankiais, kurie padeda mums išanalizuoti visą šį procesą.
Įsigilinkite į naršyklės kūrėjo įrankius
Kiekviena didžioji naršyklė – Chrome, Firefox, Edge, Safari – yra aprūpinta kūrėjo įrankių rinkiniu. „Tinklo“ skirtukas šiuose įrankiuose yra jūsų komandinė centras, norint suprasti, kaip jūsų svetainė įkeliama. Jis pateikia viską vandens kritimo diagramoje, kuri yra vizualus kiekvieno užklausos, kurią naršyklė atlieka, kad atvaizduotų puslapį, išskaidymas.
Ši vandens kritimo peržiūra yra neįkainojama. Galite tiksliai pamatyti, kiek laiko kiekvienam turtui užtruko atsisiųsti, pradedant pradiniu HTML dokumentu ir CSS stilių lapais iki vaizdų ir API užklausų. Svarbiausia, ji išskaido kiekvienos užklausos gyvenimo ciklą į atskiras fazes:
- DNS užklausa: Laikas, per kurį išsprendžiamas domeno pavadinimas į IP adresą.
- Pradinis ryšys: Laikas, praleistas nustatant TCP ryšį su serveriu.
- SSL/TLS rankų paspaudimas: Perteklinis laikas, reikalingas saugiam ryšiui nustatyti.
- Laikas iki pirmo baito (TTFB): Tai yra didelis. Jis matuoja, kiek laiko naršyklė laukė, kol gavo pirmąjį baitą duomenų iš serverio.
- Turinio atsisiuntimas: Laikas, praleistas iš tikrųjų atsisiunčiant išteklius.
Aukštas TTFB, pavyzdžiui, yra klasikinis lėto užpakalinio ar serverio pusės apdorojimo problemos ženklas – kažkas, ko paprastas ping testas niekada neatskleis. Analizuodami šią vandens kritimo diagramą, galite greitai pastebėti, kurie ištekliai blokuoja atvaizdavimą arba tiesiog užtrunka per ilgai įkelti.
Pagrindinė išvada iš mano patirties yra ta, kad nereikėtų žiūrėti tik į bendrą įkėlimo laiką, bet ir ieškoti ilgiausių juostų vandens kritimo diagramoje. Vienas neoptimizuotas vaizdas ar lėtas trečiosios šalies API gali sulaikyti visą puslapį, sukeldamas prastą vartotojo patirtį, net jei likusi svetainė veikia greitai.
Programinis matavimas su Timing API
Didesniems automatizuotiems ir tiksliems matavimams galite pasinaudoti naršyklės įmontuotomis JavaScript API. Navigation Timing API ir Resource Timing API suteikia jums programinę prieigą prie tų pačių detalių našumo duomenų, kuriuos matote kūrėjo įrankiuose. Tai puikus būdas rinkti realių vartotojų stebėjimo (RUM) duomenis, kad suprastumėte, kaip jūsų svetainė veikia realiems lankytojams visame pasaulyje.
Šiuos metrikas galite gauti vos keliais JavaScript kodais, tiesiai naršyklės konsolėje. Pavyzdžiui, norint gauti pagrindinius našumo laikus pagrindinio puslapio įkėlimui, galite naudoti performance.getEntriesByType('navigation'). Tai grąžina objektą, pilną vertingų laiko žymų.
Iš šių duomenų galite apskaičiuoti svarbias metrikas:
- DNS užklausos laikas:
domainLookupEnd - domainLookupStart - TCP rankų paspaudimo laikas:
connectEnd - connectStart - Laikas iki pirmo baito (TTFB):
responseStart - requestStart - Bendras puslapio įkėlimo laikas:
loadEventEnd - startTime
Šis požiūris leidžia jums kurti pritaikytus informacinius skydelius arba siųsti našumo duomenis į savo analizės įrankius, suteikdami nuolatinį pulsą apie jūsų programos realaus pasaulio našumą. Interneto kūrime, optimizuoti vaizdus yra įprastas būdas pagerinti šiuos rodiklius; tiems, kurie domisi, turime naudingą gidą, kaip pasirinkti geriausią vaizdo formatą jūsų svetainei.
Patikrinimų supaprastinimas su integruotais įrankiais
Šokinėjimas tarp terminalo, naršyklės kūrimo įrankių ir pritaikytų scenarijų gali greitai pabosti. Čia integruoti naršyklės plėtiniai gali tikrai pagerinti jūsų darbo eigą suvienydami šiuos patikrinimus. Pavyzdžiui, ShiftShift Extensions rinkinys apima integruotą Greitumo testą, kurį galite atidaryti iš karto iš bet kurios kortelės.
Tai suteikia jums greitą, privatumo orientuotą būdą išmatuoti jūsų ryšio atsisiuntimo greitį, įkėlimo greitį ir delsą, nereikalaujant naršyti į atskirą svetainę ar atidaryti terminalą. Kadangi tai yra didesnio įrankių rinkinio dalis, galite atlikti greičio patikrinimą, suformatuoti JSON atsakymą ir patikrinti slapuką viską iš to paties suvienyto komandų paletės. Tokia integracija daro našumo patikrinimus natūralia, be trukdžių dalimi kasdienio kūrimo proceso.
Kaip sukurti delsos testą, kuris iš tikrųjų pasako jums kažką
Bet kas gali paleisti ping komandą ir gauti skaičių atgal. Bet jei norite duomenų, kuriais iš tikrųjų galite pasitikėti—duomenų, kurie padeda jums priimti realius sprendimus—turite būti labiau apgalvoti. Vienas, izoliuotas matavimas yra tik akimirkos nuotrauka. Norint tikrai suprasti jūsų tinklo elgseną, turite galvoti kaip detektyvas, apsvarstydami, iš kur testuojate, kaip dažnai testuojate ir ko iš tikrųjų ieškote.
Gerai suprojektuotas testas paverčia žalius skaičius į veiksmingus įžvalgas. Prastai suprojektuotas? Tai tik triukšmas.
Žemiau pateiktas diagrama išskiria visus mažus delsos momentus, kurie sudaro tai, ką vartotojas jaučia, kai įkelia svetainę. Tai puikus priminimas, kad paprastas tinklo pingas net nepradeda pasakoti visos istorijos.
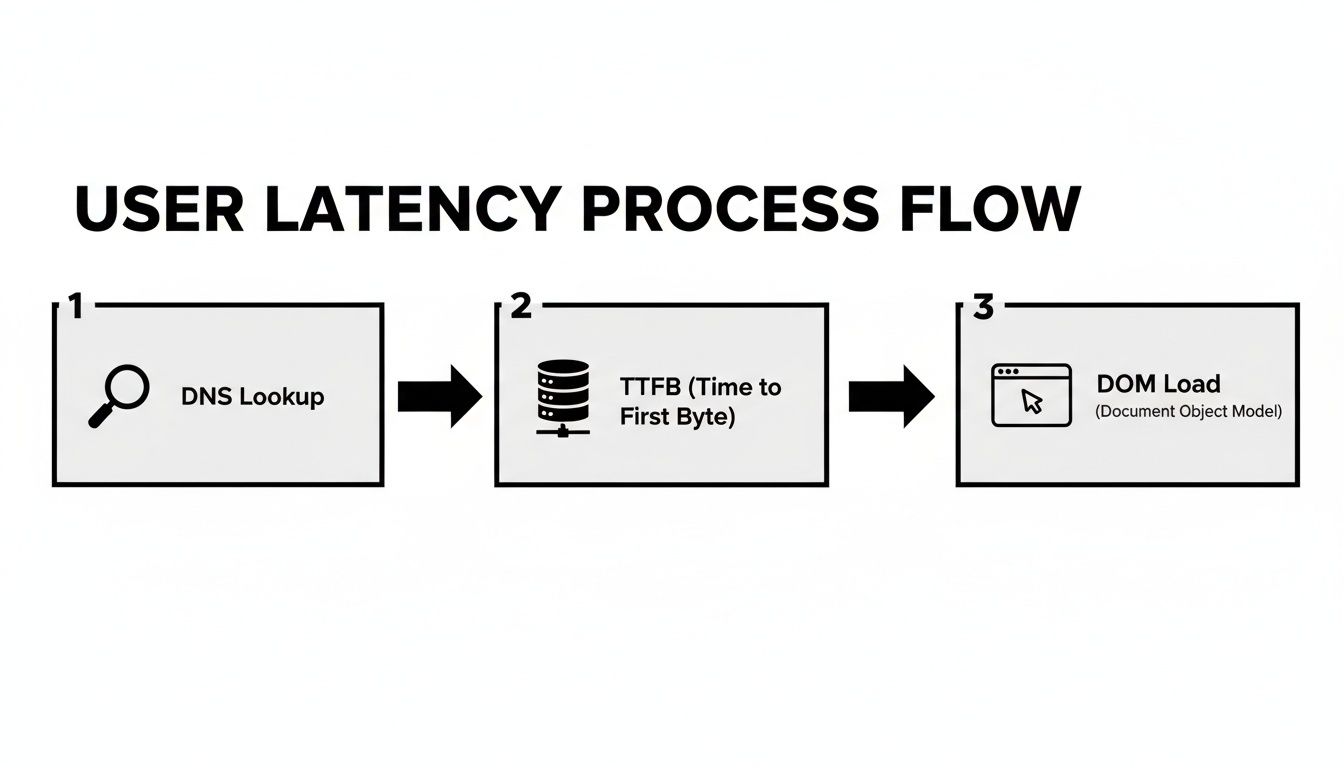
Kaip matote, nuo pradinės DNS paieškos iki galutinio atvaizdavimo, keli žingsniai prisideda prie bendro laukimo laiko.
Pasirinkite savo testavimo galinius taškus
Pirmas patikimo testavimo taisyklė yra ta, kad geografija yra svarbi. Testas iš jūsų biuro Niujorke į serverį, esantį netoli Naujojo Džersio, visiškai nieko nesako apie jūsų klientų patirtį Tokijuje. Norint gauti realistišką vaizdą, turite testuoti iš įvairių vietų, kurios iš tikrųjų atspindi jūsų vartotojų bazę.
Jūsų galinių taškų sąrašas turėtų apimti keletą pagrindinių sričių:
- Didžiausi vartotojų centrai: Kur gyvena dauguma jūsų klientų? Testuokite iš ten.
- Kryžminiai žemynų keliai: Pažiūrėkite, kas nutinka, kai duomenys turi kirsti vandenyną. Testuokite tarp Europos ir Šiaurės Amerikos arba Azijos ir JAV, kad suprastumėte ilgų atstumų našumą.
- Jūsų debesų regionai: Jei esate AWS, Azure ar GCP, testuokite ryšį į ir tarp konkrečių duomenų centrų regionų, kuriais pasikliaujate.
Išskirstydami savo testus tokiu būdu, sukuriate daug tikslesnę pasaulinio našumo žemėlapį. Tai padeda jums pastebėti regioninius siaurus vietas, kurių kitaip visiškai praleistumėte. Tai taip pat geras momentas patikrinti savo domeno nustatymą; galite rasti naudingų patarimų, kaip patikrinti domeno prieinamumą ir susijusius nustatymus, kad įsitikintumėte, jog viskas tvarkinga.
Rasti tinkamą testavimo ritmą
Tinklo sąlygos nuolat kinta. Jos keičiasi visą dieną, savaitę ir net minutę. Testas, atliktas 3 val. ryto antradienį, gali atrodyti puikiai, tačiau tas rezultatas yra nenaudingas, jei jūsų didžiausias srautas pasiekia 14 val. penktadienį, kai visi yra prisijungę.
Norint gauti tikrą bazinį lygį, turite nuosekliai testuoti per laiką. Įvairovė:
- Atlikite testus piko verslo valandomis.
- Planuokite keletą naktinių priežiūros langų.
- Nepamirškite savaitgalių, kai srauto modeliai gali būti visiškai skirtingi.
Pakartotinai imdami duomenis, galite išlyginti atsitiktinius šuolius ir kritimus. Taip galite pastebėti pasikartojančias problemas, pavyzdžiui, tinklas užsikimša kiekvieną darbo dienos popietę po pietų.
Nepamirškite apie jitter
Vidutinė delsos trukmė yra tvirtas pradžios taškas, tačiau ji dažnai slepia rimtesnę problemą: jitter. Jitter yra tiesiog kintamumas jūsų delsos trukmėje per laiką. Pagalvokite apie tai—stabilus ryšys su prognozuojamu 80ms delsos laiku dažnai yra daug geresnis realaus laiko programoms nei tas, kuris vidutiniškai yra 50ms, bet šokinėja nuo 10ms iki 200ms.
Jitter yra tylus vartotojo patirties žudikas viskam, kas yra realaus laiko, pavyzdžiui, VoIP skambučiai, vaizdo konferencijos ar internetiniai žaidimai. Didelis jitter sukelia trūkčiojantį garsą, užšalusią vaizdo medžiagą ir erzinančius delsos šuolius, kurie priverčia programą jaustis visiškai sugadinta, net kai vidutinė delsos trukmė atrodo gerai ant popieriaus.
Suprasti jitter reiškia žiūrėti už vidurkio ribų. Tai nepastebėtas piktadarys, nes jis atskleidžia, kodėl vidurkiai gali būti tokie klaidinantys. Pavyzdžiui, duomenys iš Pandora FMS rodo, kad jitter virš 30ms gali padidinti paketo praradimo rodiklius žaidimuose iki 15%—pakankamai, kad žaidimas taptų nebeįmanomas. Matavimas standartinio nuokrypio jūsų delsos rezultatuose yra pirmas žingsnis, norint įvertinti tą nestabilumą.
Delsos testo dizaino kontrolinis sąrašas
Norint viską sujungti, čia yra greitas kontrolinis sąrašas, kuris padės jums. Šių žingsnių laikymasis padės užtikrinti, kad surinkti duomenys būtų tiek tikslūs, tiek iš tikrųjų naudingi.
| Kontrolinio sąrašo elementas | Kodėl tai svarbu | Veiksmingas patarimas |
|---|---|---|
| Apibrėžkite aiškius tikslus | Negalite matuoti to, ko neapibrėžiate. Ar sprendžiate konkrečią problemą, ar nustatote bazinį lygį? | Užsirašykite savo tikslą prieš pradėdami. "Diagnostikuoti delsą vartotojams Pietryčių Azijoje" yra geresnis tikslas nei "patikrinti delsą." |
| Pasirinkite įvairius galinius taškus | Vienas kelias neatspindi jūsų pasaulinės vartotojų patirties. | Pasirinkite 3-5 vietas: vieną vietinę, vieną kitame žemyne ir kelias jūsų pagrindinėse vartotojų rinkose. |
| Nustatykite ritmą | Vienkartiniai testai praleidžia laiko pagrindu paremtus modelius, tokius kaip piko valandų užsikimšimas. | Planuokite testus automatiškai vykdyti kas valandą savaitę, kad užfiksuotumėte visą tinklo elgsenos ciklą. |
| Matavimas jitter | Vidurkiai slepia netvarkingą našumą, kuris sugadina realaus laiko programas. | Nepasitenkinkite tik vidutiniu RTT. Apskaičiuokite standartinį nuokrypį arba naudokite įrankį, pvz., mtr, kuris rodo min/max/avg delsą. |
| Naudokite tinkamus įrankius | ping yra geras greitam patikrinimui, tačiau tokie įrankiai kaip mtr ar iperf suteikia gilesnių įžvalgų. |
Interneto našumui naudokite naršyklės kūrimo įrankius. Žaliems tinklo keliams mtr yra puikus pasirinkimas. |
| Dokumentuokite viską | Po šešių mėnesių pamiršite "kodėl" už jūsų testą. | Laikykite paprastą žurnalą: data, laikas, galiniai taškai, naudotas įrankis ir trumpas pastaba apie tai, ką stebėjote. |
Būdami metodiniai, pereinate nuo paprasto delsos matavimo iki tikro jos supratimo. Šis apgalvotas požiūris skiria atsitiktinį skaičių nuo patikimo našumo rodiklio.
Skaičių prasmė (ir ko vengti)
Gerai, jūs atlikote savo testus ir turite krūvą duomenų. Čia prasideda tikras darbas—versti tuos žalius skaičius į kažką, kas iš tikrųjų turi prasmę. Duomenys pasakoja jums istoriją apie jūsų tinklo sveikatą; jums tereikia išmokti ją perskaityti.
Pavyzdžiui, staigus Round-Trip Time (RTT) šuolis traceroute yra klasikinis užuomina. Jei delsos laikas šoka trečiame šuolyje ir išlieka aukštas iki galo, greičiausiai radote savo problemą: tai trečiasis maršrutizatorius arba ryšys iškart po jo. Bet būkite atsargūs. Jei tik tas vienas šuolis rodo didelę delsą, o galutinė paskirties vieta vis dar greita, tai gali būti tik maršrutizatorius, sukonfigūruotas sumažinti prioritetą tam tikro tipo srautui, kurį naudoja jūsų testas. Tai dažnas klaidingas signalas, kuris gali nusiųsti jus į pelkę.
Jitter ir paketo praradimo dekodavimas
Žiūrint už paprasto RTT ribų, rasite svarbiausias įžvalgas. Didelis jitter, kuris yra tiesiog madingas žodis netvarkingai delsai, gali būti daug labiau trikdantis nei nuolat didelė delsos trukmė. Tai ypač tiesa viskam, kas yra realaus laiko.
Jei jūsų rezultatai rodo vidutinį RTT 40ms, tačiau minimalus buvo 10ms, o maksimalus 150ms, jūsų ryšys yra nestabilus. Tas didelis kintamumas yra būtent tai, kas sukelia erzinančius trūkčiojimus vaizdo skambučiuose ir pykčio sukeltus delsos šuolius internetiniuose žaidimuose.
Paketo praradimas yra dar didesnis raudonas signalas. Net 1% paketo praradimas gali visiškai paralyžiuoti TCP pagrindu veikiančias programas, priversdamas jas nuolat siųsti duomenis iš naujo ir sulėtindamas viską iki lėto. Kai žiūrite į savo testų rezultatus, bet koks tikras skirtumas tarp išsiųstų ir gautų paketų turi būti nedelsiant ištirtas.
Vienas didžiausių klaidų, kurias matau žmonėms darant, yra manyti, kad vienas testas pasako visą istoriją. Tinklo sąlygos nuolat keičiasi. Testas, atliktas 3 val. ryto, atrodys visiškai kitaip nei 15 val. piko verslo valandomis. Vienintelis būdas gauti tikrą našumo bazinį lygį yra nuoseklus, pakartotinis testavimas.
Norint išvengti problemų, verta pasidomėti specializuotais įrankiais tinklo našumo stebėjimui. Tai pakeičia jūsų požiūrį nuo chaotiško dalykų taisymo, kai jie sugenda, iki proaktyvaus tinklo sveikatos palaikymo.
Dažniausios matavimo klaidos
Net ir su geriausiais įrankiais pasaulyje, kelios paprastos klaidos gali padaryti jūsų rezultatus visiškai nenaudingus. Vengti šių bendrų spąstų yra neatsiejama, jei norite duomenų, kuriais iš tikrųjų galite pasitikėti.
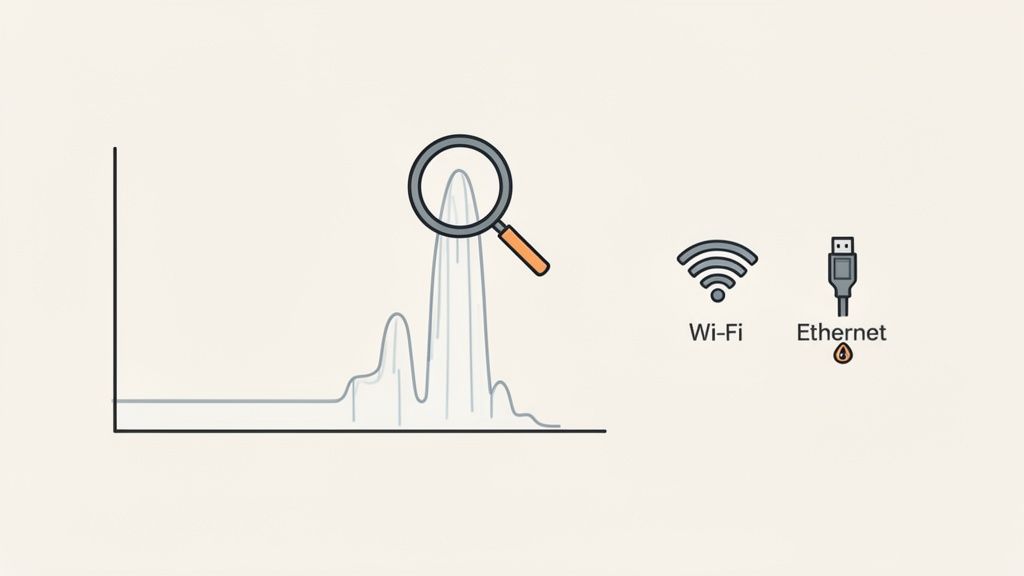
- Testavimas per Wi-Fi: Rimtai, tiesiog nedarykite to. Bevieliai ryšiai yra žinomi dėl savo nepastovumo, linkę į trukdžius nuo visko, pradedant mikrobangų krosnelėmis ir baigiant jūsų kaimyno maršrutizatoriumi. Bet kokiam rimtam delsos testavimui, prijunkite Ethernet kabelį. Tai vienintelis būdas gauti stabilų, patikimą bazinį lygį.
- Pamiršti VPN papildomą apkrovą: VPN yra puikus saugumui, tačiau jie prideda papildomą sustojimą ir šifravimą jūsų srauto kelionei. Tai visada padidins delsą. Jei bandote diagnozuoti vartotojo lėtą ryšį, vienas iš pirmųjų klausimų turėtų būti: "Ar esate prisijungę prie VPN?" Testavimas su ir be jo parodys, kiek delsos jis prideda.
- Ignore Local Network Congestion: Jūsų testų rezultatai bus iškreipti, jei kas nors kitas jūsų tinkle užima visą pralaidumą. Jei kolega transliuoja 4K vaizdo įrašą arba atsisiunčia didelius failus, kol testuojate, jūsų delsos skaičiai bus išpūsti, ir jūs galiausiai sieksite problemos, kurios iš tikrųjų nėra.
Dar vienas subtilus, bet kritinis veiksnys yra pasirinktas įrankis. Kaip jau aptarėme, skirtingi įrankiai matuoja delsą skirtingais būdais. Visada būkite nuoseklūs su įrankiais, kuriuos naudojate palyginimui, ir įsitikinkite, kad suprantate, ką kiekvienas iš jų iš tikrųjų matuoja—ar tai būtų paprastas ICMP echo, ar sudėtingas, programos lygio užklausimas. Ir atminkite, kad našumą gali paveikti daugybė sluoksnių; pavyzdžiui, jei nagrinėjate interneto našumą, mūsų gidas apie Cookie Editor Chrome Extension gali parodyti, kaip kliento pusės elementai vaidina vaidmenį.
Teisingai interpretuodami savo rezultatus ir vengdami šių bendrų klaidų, pereisite nuo paprasto skaičių rinkimo. Pradėsite suprasti kodėl jūsų tinklo našumas yra toks, koks yra, ir tai yra raktas į greitesnių, patikimesnių sistemų kūrimą.
Dažniausiai užduodami klausimai apie tinklo delsą
Net ir su tinkamais įrankiais, keletas bendrų klausimų visada atrodo iškyla, kai pradedate nagrinėti tinklo delsą. Pažvelkime į keletą dažniausiai girdimų klausimų, kad padėtume jums suprasti savo rezultatus.
Koks iš tikrųjų yra „geras“ delsos skaičius?
Tai klasikinis klausimas „priklauso“, tačiau mes tikrai galime nustatyti keletą tvirtų standartų. „Gera“ delsos trukmė yra visiškai santykinė, atsižvelgiant į tai, ką bandote pasiekti.
- Kasdienis naršymas internete: Daugumai iš mūsų bet kas, kas yra mažiau nei 100ms RTT, atrodys visiškai gerai. Puslapiai įkeliami greitai, ir jūs nepastebėsite jokio tikro delsos.
- Konkurencinis internetinis žaidimas: Čia kiekviena milisekundė yra svarbi. Rimti žaidėjai ir didelio dažnio prekiautojai ieško delsos, gerokai mažesnės nei 20ms. Tai skirtumas tarp laimėjimo ir pralaimėjimo.
- Vaizdo skambučiai ir VoIP: Čia nuoseklumas yra karalius. Jums reikia stabilios delsos, mažesnės nei 150ms, ir mažo jitter (mažesnio nei 30ms), kad išvengtumėte trūkčiojančio, nesuderinto jausmo arba, dar blogiau, prarastų skambučių.
Kaip taisyklė, dauguma tinklo profesionalų, kuriuos pažįstu, klasifikuotų bet ką, kas yra mažiau nei 50ms, kaip mažą delsą. Nuo 50-150ms yra vidutinė, o kai tik peržengiate 150ms, pradėsite jausti trukdžius daugelyje interaktyvių programų.
Kodėl mano ping ir naršyklės greičio testo rezultatai niekada nesutampa?
Tai puikus klausimas ir labai dažnas painiavos taškas. Tai atsitinka, nes komandų eilutės ping ir naršyklės greičio testas yra fundamentaliai skirtingi įrankiai, matuojantys skirtingus dalykus.
Pirmiausia, jie beveik tikrai kalba su skirtingais serveriais. Kai jūs ping domeną, jūs pataikote į konkretų tikslą. Interneto greičio testas, kita vertus, yra sukurtas rasti geografiškai artimą serverį iš savo tinklo, kad suteiktų jums geriausią galimą rezultatą.
Protokolai taip pat yra visiškai skirtingi. Ping naudoja labai lengvą protokolą, vadinamą ICMP. Dauguma naršyklės testų veikia per TCP, kuris reikalauja viso nustatymo proceso (trijų krypčių rankos paspaudimo), kad būtų užmegztas ryšys. Tas pradinis važiavimas prideda šiek tiek laiko prieš pradedant tikrą testą.
Galiausiai, naršyklės testai dažnai įtraukia daugiau nei tik gryną tinklo kelionės laiką. Jų „delsos“ skaičius gali apimti serverio apdorojimo laiką arba net mažus delsos laikus pačioje naršyklėje, kurie gali išpūsti galutinį skaičių, palyginti su žaliu ICMP ping.
Kaip aš galiu iš tikrųjų sumažinti savo tinklo delsą?
Vėlavimo mažinimas yra susijęs su butelio kaklelių paieška ir šalinimu, nesvarbu, ar jie yra jūsų biure, ar internete.
Pirmiausia reikėtų pažvelgti į savo artimiausią aplinką. Vienas efektyviausių pokyčių, kuriuos galite padaryti, yra perėjimas nuo Wi-Fi prie laidinio Ethernet ryšio. Tai yra žaidimą keičiančias stabilumui ir greičiui. Jei turite naudoti Wi-Fi, priartėkite prie savo maršrutizatoriaus ir, jei galite, prisijunkite prie 5GHz juostos – ji paprastai yra mažiau užimta.
Žvelgdami už savo vietinio tinklo, kartais DNS keitimas gali padėti. Naudojant greitesnį DNS serverį, galima sumažinti milisekundes nuo pradinio prisijungimo laiko, kai ieškote svetainės.
Jei bandote pagerinti prieigą prie paslaugos, kurią kontroliuojate, turėtumėte apsvarstyti turinio pristatymo tinklą (CDN). Jis veikia, fiziškai artindamas jūsų turinio kopijas prie jūsų vartotojų. O jei naudojate VPN, pabandykite jį išjungti. Tas papildomas šuolis ir šifravimo sluoksnis beveik visada priduria vėlavimą.
Esu matęs, kaip įmonių VPN gali pridėti net 70ms prie kelionės laiko. Tai gali paversti puikų ryšį į nepaprastai lėtą. Visada išbandykite su VPN ir be jo, kad pamatytumėte, kokį našumo smūgį iš tikrųjų patiriate.
Koks tikrasis skirtumas tarp vėlavimo ir pralaidumo?
Teisingas šio supratimas yra esminis norint suprasti tinklo našumą. Lengva juos supainioti, tačiau jie matuoja dvi labai skirtingas dalykus.
Štai analogija, kurią visada naudoju: pagalvokite apie tai kaip apie greitkelį.
- Pralaidumas yra tai, kiek juostų turi greitkelis. Daugiau juostų reiškia, kad daugiau automobilių (duomenų) gali keliauti tuo pačiu metu.
- Vėlavimas yra greičio apribojimas. Jis nustato, kaip greitai vienas automobilis (duomenų paketas) gali pasiekti A tašką iš B taško.
Galite turėti didžiulį, dešimties juostų greitkelį (milžiniškas pralaidumas) su 20 mph greičio apribojimu (aukštas vėlavimas). Galiausiai galite perkelti daug duomenų, tačiau realaus laiko dalykai, tokie kaip vaizdo skambutis, būtų skausmingai lėti. Kita vertus, ryšys su labai mažu vėlavimu jaučiasi nepaprastai greitas ir reaguojantis, net jei jo pralaidumas nėra didžiulis. Jums tikrai reikia gero abiejų pusiausvyros, kad gautumėte puikią patirtį.
Pasiruošę padaryti našumo testavimą sklandžia jūsų kasdienio darbo proceso dalimi? ShiftShift Extensions rinkinys suteikia galingą greičio testą, JSON formatavimo įrankį ir dešimtis kitų kūrėjų įrankių tiesiai jūsų naršyklėje, prieinamų vienu komandos įvedimu. Nustokite mėtyti skirtukus ir pradėkite dirbti protingiau. Atsisiųskite ShiftShift Extensions nemokamai ir padidinkite savo produktyvumą šiandien.